The modern z/OS monitoring tool

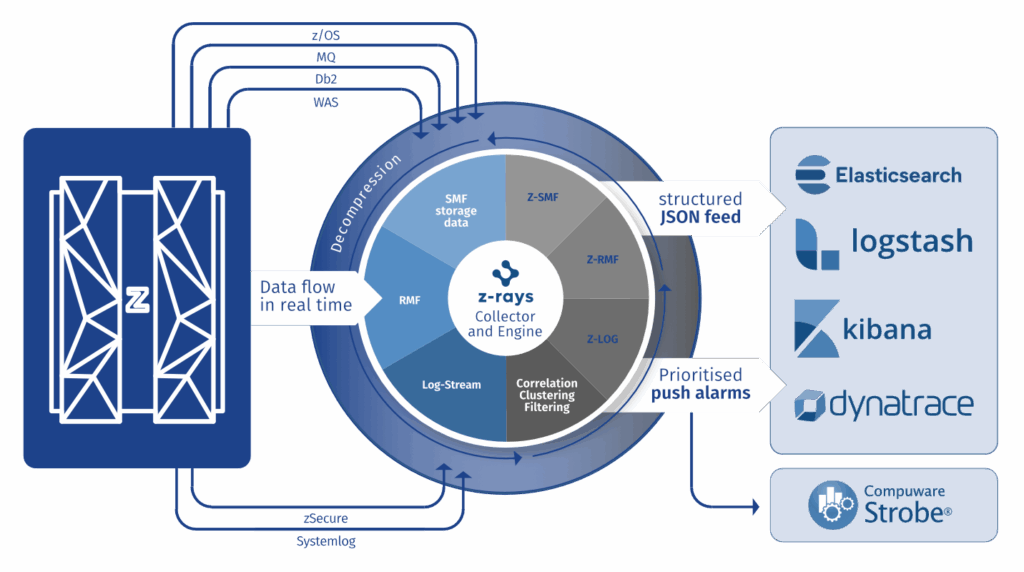
Z-RAYS is a software tool that makes z/OS performance data available, understandable and presentable or exportable. Based on existing infrastructure for accessing machine data on z/OS systems, the tool gathers data from multiple sources, including SMF records, RMF, Syslog, and security logs. The tool provides data for common analytics platforms, streaming it in almost real-time.
Analysis and management for all systems
Z-RAYS sends data in nearly real-time to multiple destinations in different formats for different consumers and allows IT operations to analyse and manage operating systems, databases and other mainframe environments.
All performance data in one place
The Z-RAYS console offers modern administrator controls with an exhaustive overview of performance and availability. This makes every administrator’s life easier by enabling them to react professionally and based on reliable data:
-
- detecting mainframe performance problems across multiple subsystems;
- allowing computer operations personnel to quickly isolate problems and take action;
- status tracking and prediction for better resource allocation, utilization and planning.
Z-RAYS is in the same tool class as Common Data Provider, Intellimagic and EPV – but compared to these competitors offers more and better features and the widest range of services. At the same time it does not limit monitored resources’ performance.
Who is Z-RAYS for?
If you operate a large infrastructure and have organizational or technical challenges due to increasing systems complexity which produces too much data to analyse, Z-RAYS is the solution. Z-RAYS tools address the difficulties that come with a dynamic workload, old reporting processes, manual analytics and a lack of experts.
Smart data collection across all sources covers everything from SMF records, over RMF records, Syslogs, DB2 performance metrics (100, 101), network performance metrics (TCPIP, TCP/UDP), application subsystem metrics, security logs and events, to hardware performance statistics and many others, doing this in nearly real-time mode. To avoid data garbage, it is key to find the right metrics, to identify the relationships between them and to construct relevant information to avoid noise. This is exactly what Z-RAYS does.
AI algorithms automatically detect anomalies in performance data. This helps to find patterns that are used in time series modelling to detect anomalies in your current data, to make forecasts based on historical data and to automatically detect incidents.
No expert nor traditional algorithm could do so due to the extent of relevant data and of invisible dependencies. Z-RAYS makes the invisible, visible.
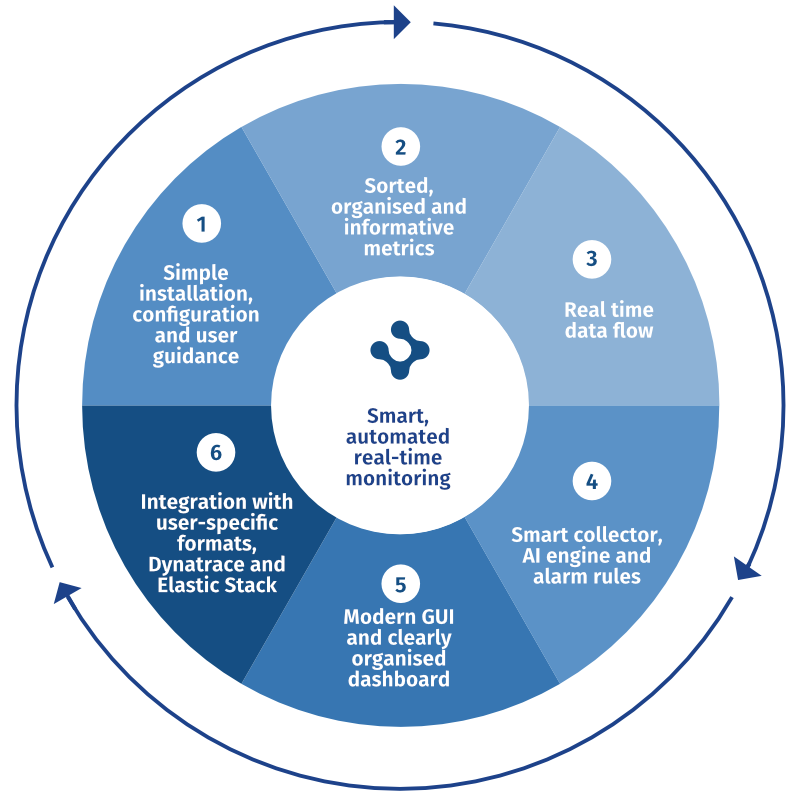
Z-RAYS includes installation, custom parametrization, daily visual monitoring, setting alerts and integration with other tracking or analytical tools. All of this combined gives administrators all the tools they need, whenever and wherever they need them.
Z-RAYS covers all levels

Z-RAYS’ key differentiator compared to other mainframe analysis tools is the ease with which you can integrate it with the world’s leading monitoring and analysis technologies. Z-RAYS supports:

Elastic Stack (formerly known as the ELK Stack), which is a collection of the popular open-source software tools Elasticsearch, Logstash, Kibana, and Beats.
Dynatrace, a popular all-in-one solution to monitor the performance of applications and cloud infrastructure, digital experience, business analytics and AIOps.
Compuware Strobe, Zabbix, Splunk … – Z-RAYS can readily integrate with other tools.
The benefits of Z-RAYS
Z-RAYS automates monitoring, eliminates many manual tasks, and quickly identifies the causes of incidents. It provides alerts, allows the configuration of exceptions and anomalies, and predicts levels of resource utilisation. Better monitoring means reduced MSU (million service units) and related processor costs which lead to considerable savings. The tool protects your organization from outages and the associated losses. Moreover, it provides information for proper resource planning.
Z-RAYS saves a lot of administrator time spent on solving problems and reduces the cost of systems monitoring.
As a result, it makes a considerable contribution to comprehensive mainframe monitoring and to distributed monitoring within a streamlined and exhaustive mainframe management.
How Z-RAYS operates
Z-RAYS consists of two agents and a dashboard. The agents run around the clock and are able to fully exploit the zIIP processors’ performance. Monitoring captures data from different sources:
Z-RAYS RMF Agent: delivers z/OS performance metrics based on data available within the IBM Resource Management Facility (RMF). The RMF agent selects, formats and sends the most important performance metrics to external analytical systems in real time.
Z-RAYS SMF/LOG Agent: delivers z/OS performance metrics based on data available within the System Management Facility (SMF). The SMF agent covers all performance relevant data. It simplifies the collection, parsing and visualisation of events from all z/OS system protocols and displays them centrally in one place.
How Z-RAYS works

The dashboard offers insightful reports, figures and diagrams. Z-RAYS offers a series of pre-defined dashboards that give administrators the ability to configure and select what they need to see. These are in addition to displays in Elastic, Dynatrace and other tools. The most frequent SLOs are based on the most important metrics.
Z-RAYS Dashboard

Each use case is a bundle of metrics related to the Z-RAYS metrology:
-
- SL01: CP processor utilization by system,
- SL02: zIIP processor utilization by system,
- SL03: CPU by job, top x,
- SL04: zIIP by job, top x,
- SL05: Memory by system,
- SL06: Network utilization.
The presentation layer is based on ELK or Dynatrace. It allows for filtering and sorting by various metrics. Using the drill down methods it is easy to get to lower level dashboards, charts or source data in JSON format. The Dashboard also supplies methods to create alerts based on machine learning algorithms which predict the average values for all metrics and can be used to trigger alerts in various formats: event log records, highlights, inputs into customer systems.
Below is a sample screenshot of a dashboard in the Elastic environment:

